Digitize datasheets with Dagra to get numerical data from graphs for your analysis. Use digitized data from PDF files in Excel, Matlab or any program that can read text files. To use Dagra to digitize the data:
- Import the graph from the datasheet into Dagra
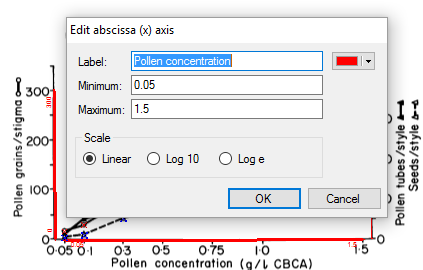
- Setup the graph’s axes in Dagra
- Trace the graphical data using Dagra’s Bezier tool or point selector
- Export the numerical data to your favorite analysis tool

Tip: Increase the size of the graph, using your PDF Viewer’s zoom settings, until it fills the screen before you graph the graph. This will give you a high resolution image for tracing the data.
Holding down the Control key while rolling the mouse wheel is a fast way to zoom in many programs (including Dagra).
Importing a Graph from a Data-sheet
There are two easy ways to grab a copy of the graph in the datasheet and import it into Dagra. Either
- Use Adobe Reader’s snap-shot tool. The snap-shot tool moves around a bit in different versions of Reader. You’ll find it in the Edit → Take a Snapshot or the Tools → Select & Zoom → Snapshot Tool menu.
- Use Dagra’s screen-shot tool. Choose File → New from Screenshot in Dagra.

Setup Graph Axes
Dagra needs to know where the graph’s axes are to map data from its position in the picture to the graph’s scale.
Dagra will place default axes on the graph automatically. The default axes are drawn as red horizontal (typically the x-axis) and vertical (typically the y-axis) lines.
Line up Dagra’s axes with the axes on the graph. Drag the axis from the middle to move the whole axis around the page. Drag the ends to move just the end points.

Click the Edit… button on the Axis tab to set the
- Axis label
- Minimum value on the graph’s scale. This should match the point on the graph where Dagra’s axis starts.
- Maximum value on the scale. This should match the position on the graph where Dagra’s axis finishes.
- Axis scaling: linear, log10 or loge
You can add additional axes if your graph has a secondary x- and/or y-axis. Additional axes are also useful if there is more than one graph in the image.
Trace the Data-sheet Graph’s Data
To trace data, switch to the Series tab. The graph in this example is a set of lines so select New Series → Curve.
Begin tracing by pressing and dragging to set a point and its tangent at the start of the curve. Release the mouse button to set the point. Keep adding points and tangents along the curve. Typically just a few points are needed for most curves. Only 5 points were set to trace the thermal resistance curve of a LM35 temperature sensor in the example below. Dagra interpolates the rest automatically, fitting a smooth curve to the data.
Don’t worry about getting it perfect at the start. The goal here is to setup a few points that captures the rough shape. You can clean them up using the Edit tool.

Export the Digitized Data to Your Favorite Analysis Tool
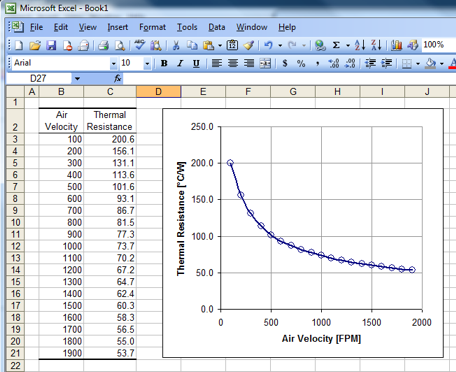
Dagra is not a complicated new analysis too to learn. The likes of Matlab, MathCAD and Excel have the analysis side well covered already. To use data digitized with Dagra either:
- Copy digitized data to the system clipboard (Edit → Copy Data
- Export the data to a text file (File → Save As…)
- Open the Dagra project file in Matlab, Python or Microsoft Excel and read the digitized data directly. See Reference → Using Dagra Data in other Applications in the Dagra help for more information.

Summary
In summary, to digitize graphs in data-sheets so that you can use the numerical data simply:
- Grab a screen-shot of the graph using Dagra’s screen-shot tool or Adobe Reader’s snap-shot tool.
- Setup the axes in Dagra to match the axes of the graph image
- Trace the graph contents with Dagra’s tracing tool
Then in 3 simple steps you’ll have numerical data that you can import into your favorite analysis tool.


